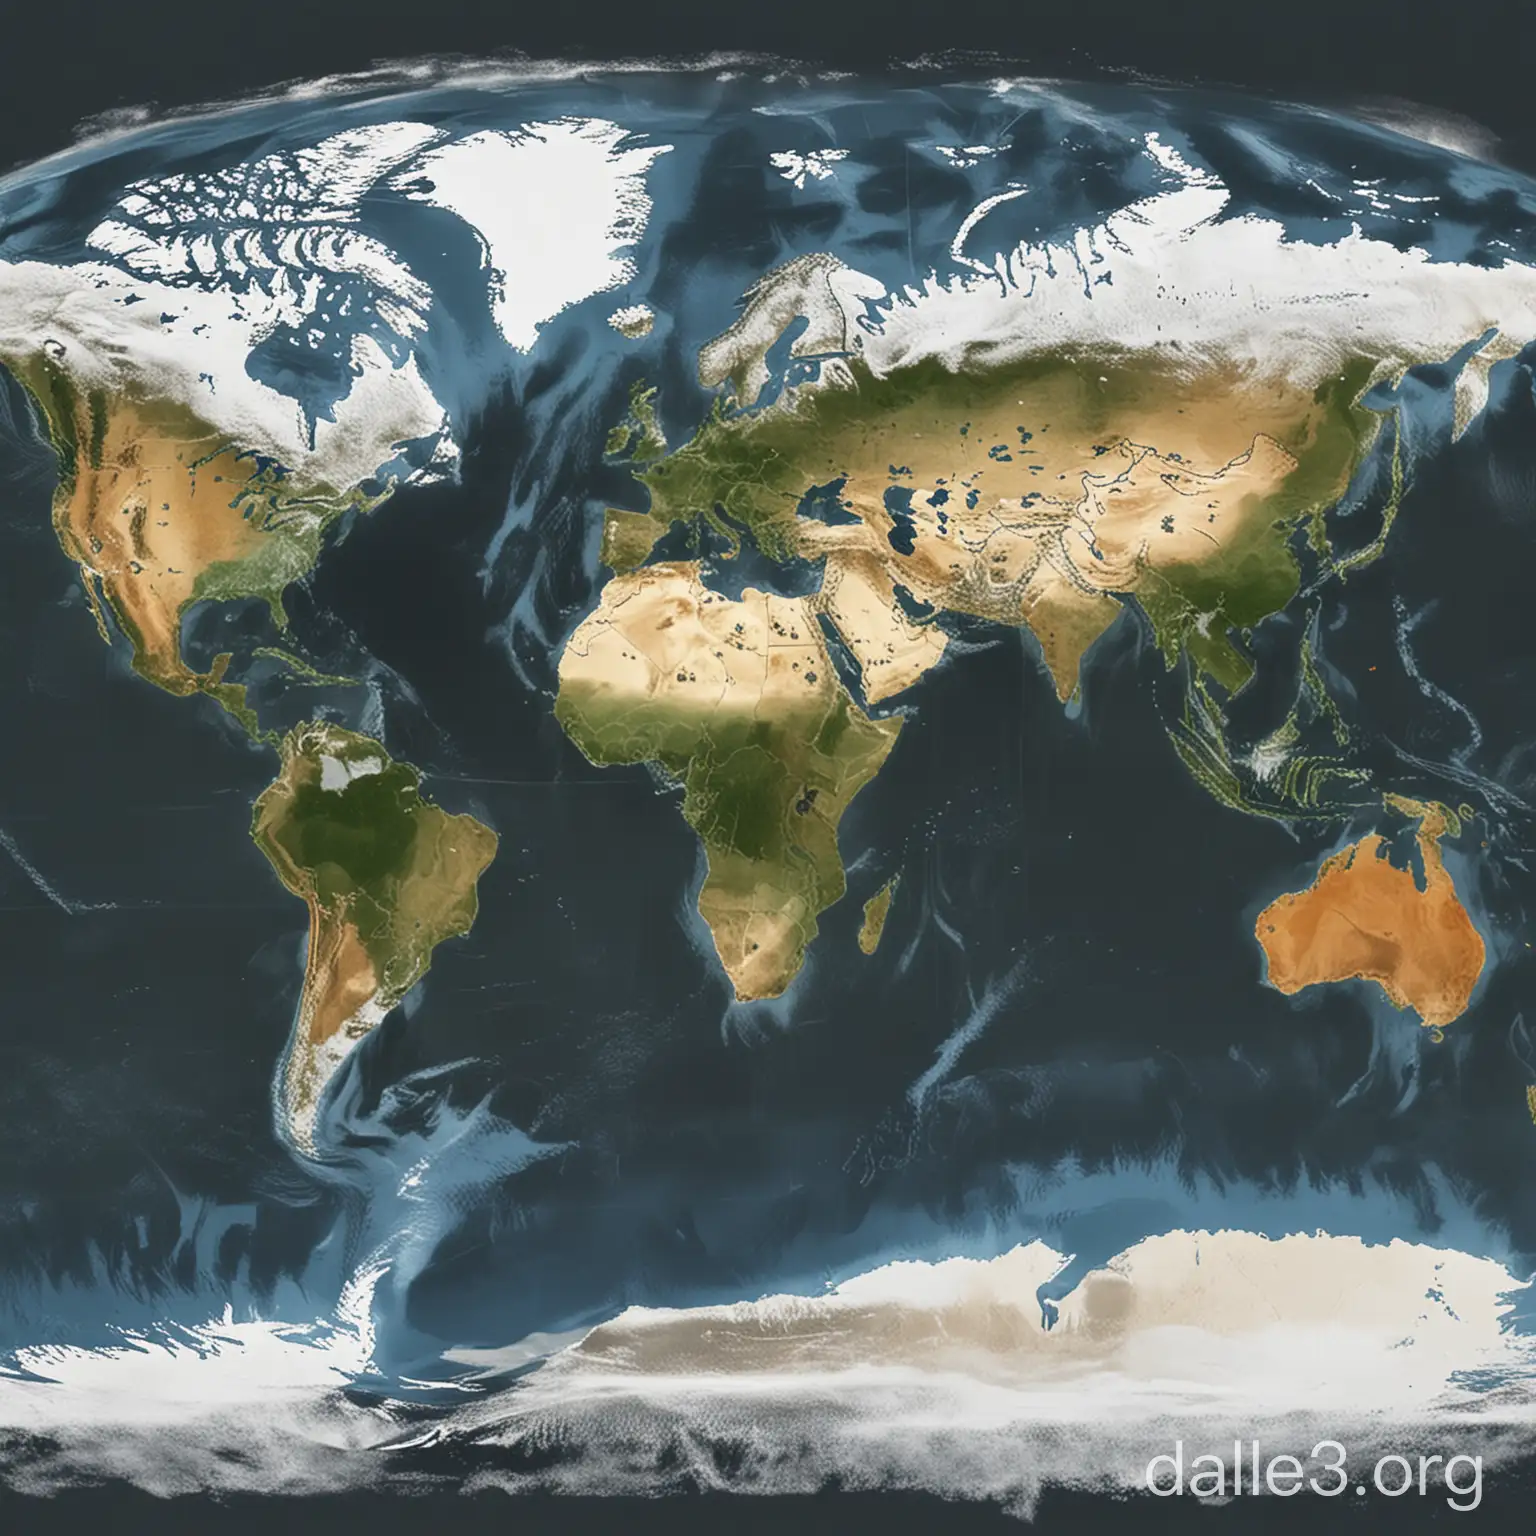
Global Climate Change Map
AI Art Image Prompt
Prompt
Global Climate Change Map
Glacier Melting and Polar Changes
Accelerating Glacier Melting Rate
Rising Sea Levels and Coastal Threats
Frequent Extreme Weather Events
Heatwaves, Droughts, Floods
Destruction and Impacts
Urgency of Environmental Issues
Environmental Protection Actions and Personal Responsibility
International Cooperation and Global Climate Governance
AI Art Prompt Analyze
- Subject: The central focus of the image is a detailed map illustrating global climate change patterns and impacts. The map likely showcases various geographical regions, highlighting areas of temperature rise, sea level changes, and other environmental shifts. It serves as a visual representation of scientific data, aiming to educate and raise awareness about climate change. Background/Style/Coloring: The background may include a color gradient from cool blues to warm reds, symbolizing temperature variations. The style is likely to be informative and scientific, with clear labeling and possibly graphical elements like arrows or charts to denote trends. Action/Items: There may not be specific actions depicted, as the focus is on data visualization. Items such as map legends, scales, and annotations are essential to convey information effectively. Costume/Appearance/Accessories: Since the image revolves around a map, there are no human or animal subjects, costumes, or accessories. However, digital representations like icons for cities, glaciers, or forests could be included to enhance understanding.